Story Maps by Northwestern’s Knight Lab
test test
test test
Screenshot from Sutori homepage.
Sutori (formerly HSTRY) is a web-based platform that makes it easy to create interactive stories or timelines. These “stories” are multimedia-rich and can be used as a content delivery tool by teachers or a project deliverable by students.
Teachers can use pre-existing timelines made by Sutori or other users. On the teachers page there are examples from different subjects including art, history, social studies, and religion. Teachers can also create their own custom stories adding text, images, and links. For student use, teachers can create custom groups for creating and sharing within a class.
The free version includes the following features:
In the 2016-17 spring semester, eighth-grade students at Harpeth Hall used Sutori to create civil rights timelines. Each individual student had to choose 20 significant events and include both media (image or audio/video link) and a text description. I also use Sutori for my doctoral work with timelines for historical trends in education, educational leadership theories, and learning science theories. If you would like to know more about Sutori or how you might use it in your classroom, please feel free to contact me. Also, visit Common Sense Media for more teacher reviews.
Caitlin McLemore
Academic Technology Specialist @ Harpeth Hall School
Doctoral Student @ Johns Hopkins University
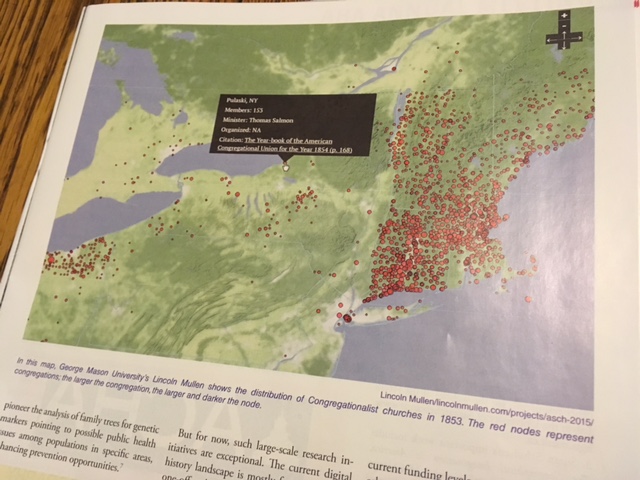
Same of CARTO map using data from the WPA Slave Narratives, collected in the 1930s.

CARTO (created by Vizzuality) is an open-source, online, cloud-based software system that is sure to please anyone seeking to visualize and store data using geospatial mapping. Basic usage is free with an account; however, better and expanded options are available with a paid subscription. The free account is accompanied by 50mb of storage, and data can be collected and directly uploaded from the web and accessed via desktop, laptop, tablet, or smart phone. Part of what makes CARTO so intuitive is its user-friendly interface. Users can upload files with a simple URL cut/paste or file drag/drop. The program also accepts many geospatial formats, such as excel, text files, GPX, and other types of shapefiles, making CARTO useful for humanities and STEM-related disciplines alike. Once multiple data layers are uploaded users can create a visualization and manipulate this visualization through several modes: heat, cluster, torque, bubble, simple, and others. Once the visualizations have been organized and customized, CARTO also provides convenient options to provide links and embed codes to share the map. Finally, CARTO does a great job answering questions with online tutorials, FAQs, and “tips and tricks.” Google maps first ventured into web-based mapping tools, but CARTO takes it to a whole new level.
Whether in a biology lab, pre-cal class, or world cultures — digital mapping is a definite way to enhance a unit. I highly recommend CARTO. Let me know if you’d like a test-drive or tutorial to learn more.